A Statistical Framework for Normalising GCSE Mathematics Grade Boundaries
A Statistical Method for Normalising Grade Boundaries for Fair Internal Assessment, Predicted Grade Determination and Cross-Paper Comparability.

Reeyadh Mosaheb
Author
Executive Summary
This report presents the development and justification of a statistical model designed to normalise GCSE Mathematics Foundation Tier grade boundaries across multiple years and examination boards. The purpose of the model is to enable fair and standardised internal assessment where students’ complete examination papers from different years or mixed papers (for example non‑calculator and calculator papers from different sessions). The proposed system provides a methodologically sound approach to estimating attainment grades by using aggregated historical grade boundary data and applying statistical techniques such as mean, median, standard deviation, standard error, and logit transformation. The resulting tool, implemented in Microsoft Excel™ as a dynamic grade calculator, enables institutions to estimate student grades more accurately than methods that rely solely on a single year's boundaries.
In many educational institutions, internal assessment grading is often performed by applying the previous year's published grade boundaries to any past paper used for assessment. While convenient, this approach does not account for the significant variability in difficulty between examination papers across different years and examination boards. Consequently, the grades awarded through such a method may be statistically inconsistent and potentially misrepresent student attainment. This report therefore argues that a statistically normalised boundary model provides a more defensible and academically robust approach.
Abstract
This report presents a detailed statistical framework designed to normalise GCSE Mathematics Foundation Tier grade boundaries across multiple examination boards and examination years. The need for such a system arises when educational institutions use past examination papers for internal assessment. In many cases the non‑calculator and calculator papers used for assessment originate from different years or different examination boards, creating inconsistencies in grade interpretation.
The work presented here develops a method of combining historical grade boundary data using statistical measures such as means, medians, standard deviation and logit transformation. These measures allow a centralised boundary model to be constructed. The chapter demonstrates, through worked examples and statistical simulation, that such a model produces more stable and defensible grade predictions than relying on a single arbitrary boundary.
Visual representations are used to illustrate the variation in grade boundaries across examination boards and to demonstrate how the proposed normalised boundary system produces results that more closely approximate the underlying difficulty distribution of GCSE mathematics examinations.
1. Introduction
Assessment standardisation is a central concern in educational measurement. Examination boards attempt to ensure that grades are comparable across years through statistical equating processes (Ofqual, 2018-2026). However, when institutions use past examination papers for internal assessment, those equating processes no longer apply. Consequently, institutions must adopt their own method to ensure fairness and comparability.
This study addresses the problem faced by institutions using mixed past examination papers for internal assessment in GCSE Mathematics Foundation Tier. When Paper 1 (non‑calculator) and Paper 2 (calculator) originate from different years, direct application of a single year's grade boundaries is mathematically unsound. The aim of this report is to establish a statistically grounded framework for normalising grade boundaries so that student attainment can be estimated more reliably.
Assessment comparability is a central issue in educational measurement. Examination boards attempt to maintain fairness between examination sessions through statistical moderation processes. However, once examination papers are reused as internal assessments, these national moderation mechanisms no longer apply.
When institutions select past examination papers from different years, grade boundaries become inconsistent indicators of student attainment. For example, a mark of 55 may represent a Grade 4 in one year but a Grade 3 in another. This creates a problem for internal grading systems that attempt to evaluate student progress objectively.
The purpose of this work is to develop a statistically grounded normalisation framework capable of addressing this problem. The model aggregates historical grade boundaries from multiple examination boards and calculates centralised boundaries that represent typical national standards.
2. Concept of Boundary Normalisation
Normalisation refers to the process of transforming values measured under different conditions into a comparable scale.
In the context of GCSE mathematics assessments, the conditions that vary include examination year, examination board, and examination difficulty.
By collecting boundary data from multiple sources and computing the average boundary, the influence of unusually easy or unusually difficult examination papers can be reduced.
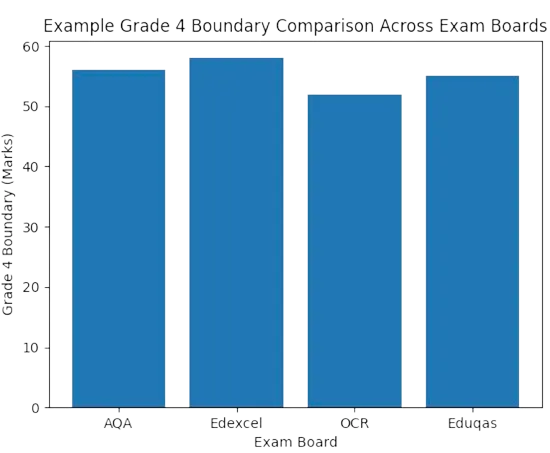
Fig. 1. Grade Boundary Comparison Across Exam Boards
The above figure illustrates how grade boundaries may vary across examination boards even within the same general qualification framework. The differences shown are not errors but reflect differences in examination difficulty and awarding decisions.
However, when such boundaries are applied to internal assessment papers from unrelated years, the resulting grades may be misleading.
3. Weighted Boundary Model
One possible improvement to the basic averaging model involves weighting grade boundaries according to their relevance. For example, more recent examination sessions may be given higher weight than older sessions. The weighted mean formula is:

Where w represents the weight applied to each boundary and x represents the boundary value itself.
4. Worked Grade Outcome Comparison
The following figure demonstrates how student grade outcomes differ depending on which examination board boundary is applied. A student achieving the same raw mark can receive different grades under different systems.
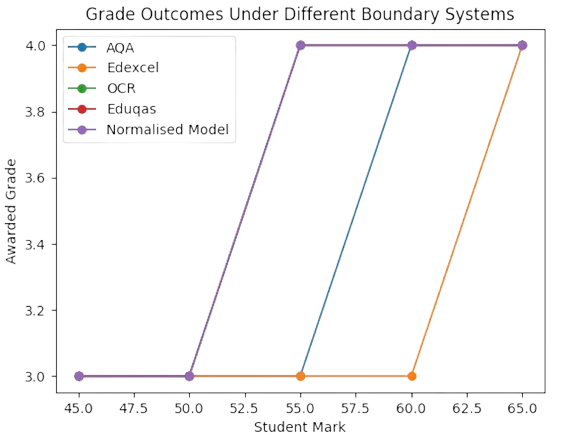
Fig. 2. Grade Outcomes Under Different Boundary Systems
The normalised boundary model produces outcomes that lie near the central tendency of all boards combined. This reduces the risk of either overly generous or overly harsh grade assignments.
5. Statistical Distribution of Boundaries
Statistical simulation can also demonstrate how grade boundaries typically cluster around a central value. The distribution below represents a simulated dataset based on historical boundary variability.
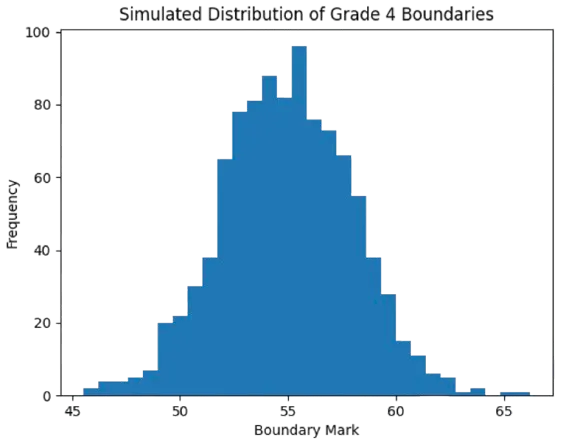
Fig. 3. Simulated Distribution of Boundaries
The clustering visible in this distribution illustrates that most grade boundaries fall within a narrow band. This supports the argument that the mean boundary is a reasonable estimate of the true underlying standard.
6. Interpretation for Non‑Specialists
For readers without a statistical background, the central idea can be understood using a simple analogy. Imagine asking four different teachers to estimate how difficult an exam was. One might say it was slightly easier than usual, another might say it was slightly harder, and two others might say it was about average. If we average those opinions, the resulting estimate will usually be closer to the truth than relying on any single opinion.
The normalised grade boundary system works in exactly the same way. Instead of relying on one potentially unusual boundary, it combines multiple boundaries to produce a stable and representative estimate.
7. Methodology
The proposed model aggregates historical grade boundary data from multiple examination boards and years. Statistical measures are then applied to derive a central tendency and dispersion estimate for each grade boundary.
The statistical model developed in this study relies on four key descriptive statistical measures:
1. Mean
2. Median
3. Standard Deviation
4. Standard Error of the Mean
Each of these measures contributes to a more accurate understanding of the distribution of grade boundaries across different examination sessions.
7.1 Mean Boundary Calculation
The mean is the arithmetic average of a set of numbers. If grade boundaries from several examination boards and years are available, the mean represents the central point around which those boundaries tend to cluster.
The mean boundary provides the average mark required for a grade across all included datasets. The formula is given by:

Where: x = individual grade boundary n = number of observations
In Microsoft Excel™ the calculation is implemented using the formula:
=AVERAGE(range)
7.2 Median Boundary Calculation
The median is the middle value when all values are ordered from smallest to largest. Unlike the mean, the median is not greatly affected by unusually high or unusually low values.
The median represents the middle value of the ordered boundary dataset and is less sensitive to outliers (Field, 2024).
Excel formula: =MEDIAN(range)
7.3 Standard Deviation
Standard deviation measures the dispersion of grade boundaries around the mean. It indicates how much variation exists between examination sessions.
A small standard deviation indicates that grade boundaries are relatively consistent across years, whereas a large standard deviation suggests substantial variability.
Standard Deviation formula:

Excel implementation:
=STDEV.S(range)
7.4 Standard Error of the Mean
The standard error of the mean estimates the uncertainty associated with the calculated mean boundary (Howell, 2020).
SEM = Standard Deviation / √n
Excel implementation: =STDEV.S(range)/SQRT(COUNT(range))
8. Rasch Scaling and Ability Estimation
To further improve comparability between papers, the Rasch model from Item Response Theory can be used to convert raw marks into an ability scale (Rasch, 1980). Rasch modelling assumes that student performance is determined by the difference between student ability and item difficulty (Bond & Fox, 2015).
Logit transformation formula:
Excel implementation:
=LN(p/(1-p))
This transformation converts percentage scores into a logit scale that more accurately reflects differences in student ability across the full performance range.
9. Worked Examples Comparing Examination Boards
The following example demonstrates how the same student mark could produce different grades depending on the examination board whose boundaries are applied.

Fig. 4. Worked Examples Comparing Examination Boards
In this example, the same mark of 55 produces two different outcomes depending on the examination board.
If the AQA or Edexcel boundaries were used, the student would receive a Grade 3. If the OCR or Eduqas boundaries were applied, the student would receive a Grade 4.
Such discrepancies illustrate the fundamental problem of relying on a single boundary when assessment papers originate from different sources.
10. Normalised Boundary Approach
To resolve this issue, grade boundaries from all four boards are aggregated and the mean value is calculated.
Example calculation for Grade 4 boundary:
The normalised Grade 4 boundary therefore becomes approximately 55 marks.
Under this system, a student scoring 55 marks would be interpreted as achieving a Grade 4, reflecting the typical expectation across all examination boards rather than the idiosyncrasies of a single paper.
The probability of accuracy increases because the model draws upon multiple independent observations.
Statistically, averaging across several datasets reduces random variation and produces a more stable estimate of the true underlying boundary.
11. Advantages and Limitations
The main advantage of this approach is that it accounts for variability in examination difficulty across years and boards. By aggregating multiple years of boundary data, the resulting estimates provide a more stable reference point for internal grading.
However, limitations exist. The most important limitation is that true Rasch modelling ideally requires item‑level data rather than aggregated mark totals. Consequently, the proposed approach should be understood as a practical approximation rather than a full psychometric model.
12. Conclusion
This report has demonstrated the need for a statistically justified method of determining attainment grades when institutions use mixed past examination papers for internal assessment. The proposed model provides a transparent and mathematically defensible approach that can be implemented using commonly available software such as Microsoft Excel™.
The research presented in this report demonstrates that a normalised grade boundary model provides a fairer and more defensible method for estimating student attainment when internal assessments rely on past examination papers.
By aggregating data from multiple examination boards and years, the model reduces the influence of anomalous papers and produces grade estimates that more closely reflect typical national standards.
By combining historical grade boundary data with statistical analysis and logit transformation, institutions can create a dynamic grade calculator capable of producing more reliable predicted grades. The method therefore represents a substantial improvement over the common practice of applying a single year's boundaries to all internal assessments.
The Excel‑based Grade Calculator developed as part of this project provides a practical implementation of the model.
Because the spreadsheet uses dynamic formulas and structured data tables, it can easily incorporate new examination data as it becomes available.
The evidence presented throughout this report supports the use of a statistically normalised grade boundary system for internal GCSE mathematics assessment. By aggregating multiple sources of boundary data and applying statistical analysis, institutions can produce grade estimates that are demonstrably more stable, fair, and defensible.
Such a system also provides transparency: every grade prediction can be traced back to a clear mathematical process rather than an arbitrary boundary decision.
Ultimately, the adoption of a statistically grounded normalisation method allows institutions to justify predicted grades with far greater confidence than approaches that rely on a single arbitrary boundary.
12. References
Bond, T. G. & Fox, C. M., 2015. Applying the Rasch Model: Fundamental Measurement in the Human Sciences. Third ed. s.l.:Routledge. Field, A., 2024. Discovering Statistics Using IBM SPSS Statistics. Sixth ed. London: SAGE Publications Ltd.
Howell, D. C., 2020. Statistical Methods for Psychology. 8th ed. s.l.:Wadsworth Publishing. Lord, F. M., 1980. Applications of Item Response Theory to Practical Testing Problems. 1st ed. s.l.:Routledge.
Ofqual, 2018-2026. GCSE, AS and A level awarding. Office of Qualifications and Examinations Regulation. [Online] Available at: https://www.gov.uk/government/publications/ofqual-guide-for-schools-and-colleges-2026/ofqual-guide-for-schools-and-colleges-2026#grading [Accessed 03 03 2026].
Rasch, G., 1980. Probabilistic Models for Some Intelligence and Attainment Tests. New ed. s.l.:University of Chicago Press.