A Statistical Framework for Normalising GCSE Mathematics Grade Boundaries
The Grades Calculator

Reeyadh Mosaheb
Author
Data Collection and Calculations
Exam Boards Grade Boundaries
Grade boundary data for GCSE Maths (Foundation Tier) was collected from all four major UK exam boards — AQA, Edexcel, Eduqas, and OCR — across every available summer series, and compiled into an Excel spreadsheet. While exam papers vary between two and three papers depending on the board, all have a combined total of 240 marks, with the exception of OCR, which is marked out of 300. To ensure consistency, OCR's grade boundaries were scaled down to their 240-mark equivalents.
The same process was carried out for GCSE English Language.
The dataset spans from 2017 to the most recently available boundaries in 2025. The spreadsheet is designed to be easily updated, so future years' boundaries can be added as they are released — keeping the calculator current with minimal effort.

Historical Grade Averages
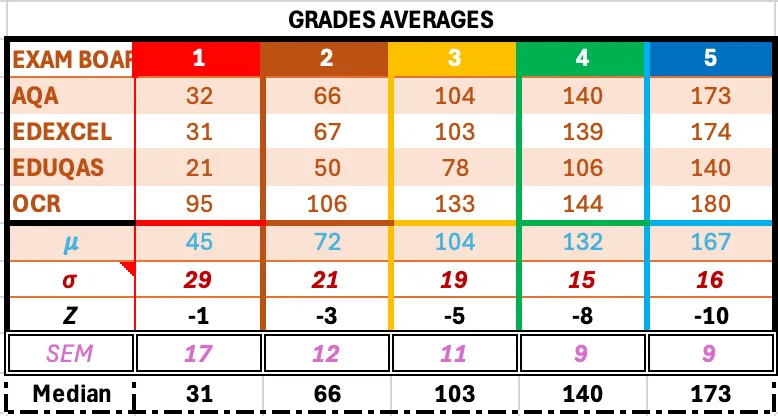
Using the historical grade boundaries described above, the average boundary mark for each grade is calculated per exam board. Alongside this, a range of descriptive statistics are derived for each grade, including the mean, standard deviation, Z-scores, standard error of measurement, and the median. These are displayed in the table on the left.
The Calculator Brain
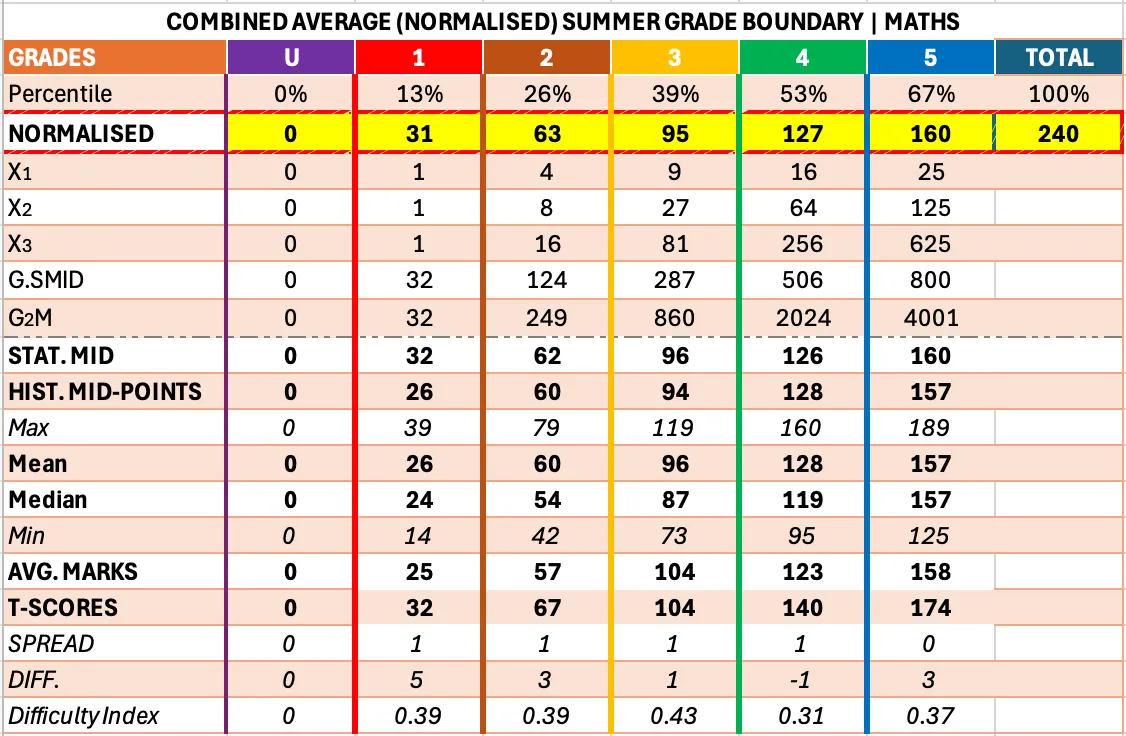
Combined Average (Normalised) Summer Grade Boundaries | Maths
The grade boundaries in this table were calculated using a multi-step statistical process. First, several reference points were gathered for each boundary: historical mid-points, statistical mid-points, average marks, T-Scores, standard deviation, standard error of measurement, and the overall spread of the data. These were used both as comparative measures and applied directly where appropriate.
Polynomial Regression was then applied to normalise each grade boundary, and percentiles were calculated for each. The result is the Normalised Grade Boundary — a statistically derived boundary that accounts for historical variation, data spread, and measurement error. It is designed to serve as a reliable, consistent benchmark that can be applied to any exam board paper from any year, giving a fairer and more accurate indication of learner attainment.
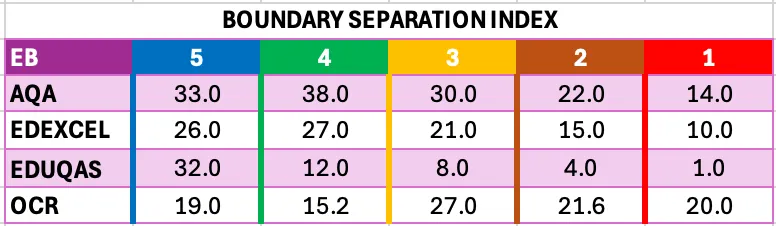
Historical Average Grade Boundary Separation Index
The Boundary Separation Index shows the mark gap between consecutive grade boundaries for each exam board. In other words, it indicates how many marks separate one grade from the next — for example, the gap between a grade 4 and a grade 5, or a grade 2 and a grade 3.
This is a useful diagnostic measure, as it highlights how generously or tightly spaced the grade boundaries are for a given paper. Larger separations suggest a wider margin between grades, while smaller separations indicate that grades are closely clustered, meaning a small number of marks can make a significant difference to a learner's outcome. Notably, Eduqas shows a pronounced narrowing of separations at the lower grades, whereas AQA and OCR maintain comparatively larger gaps across the grade range.
The Magic
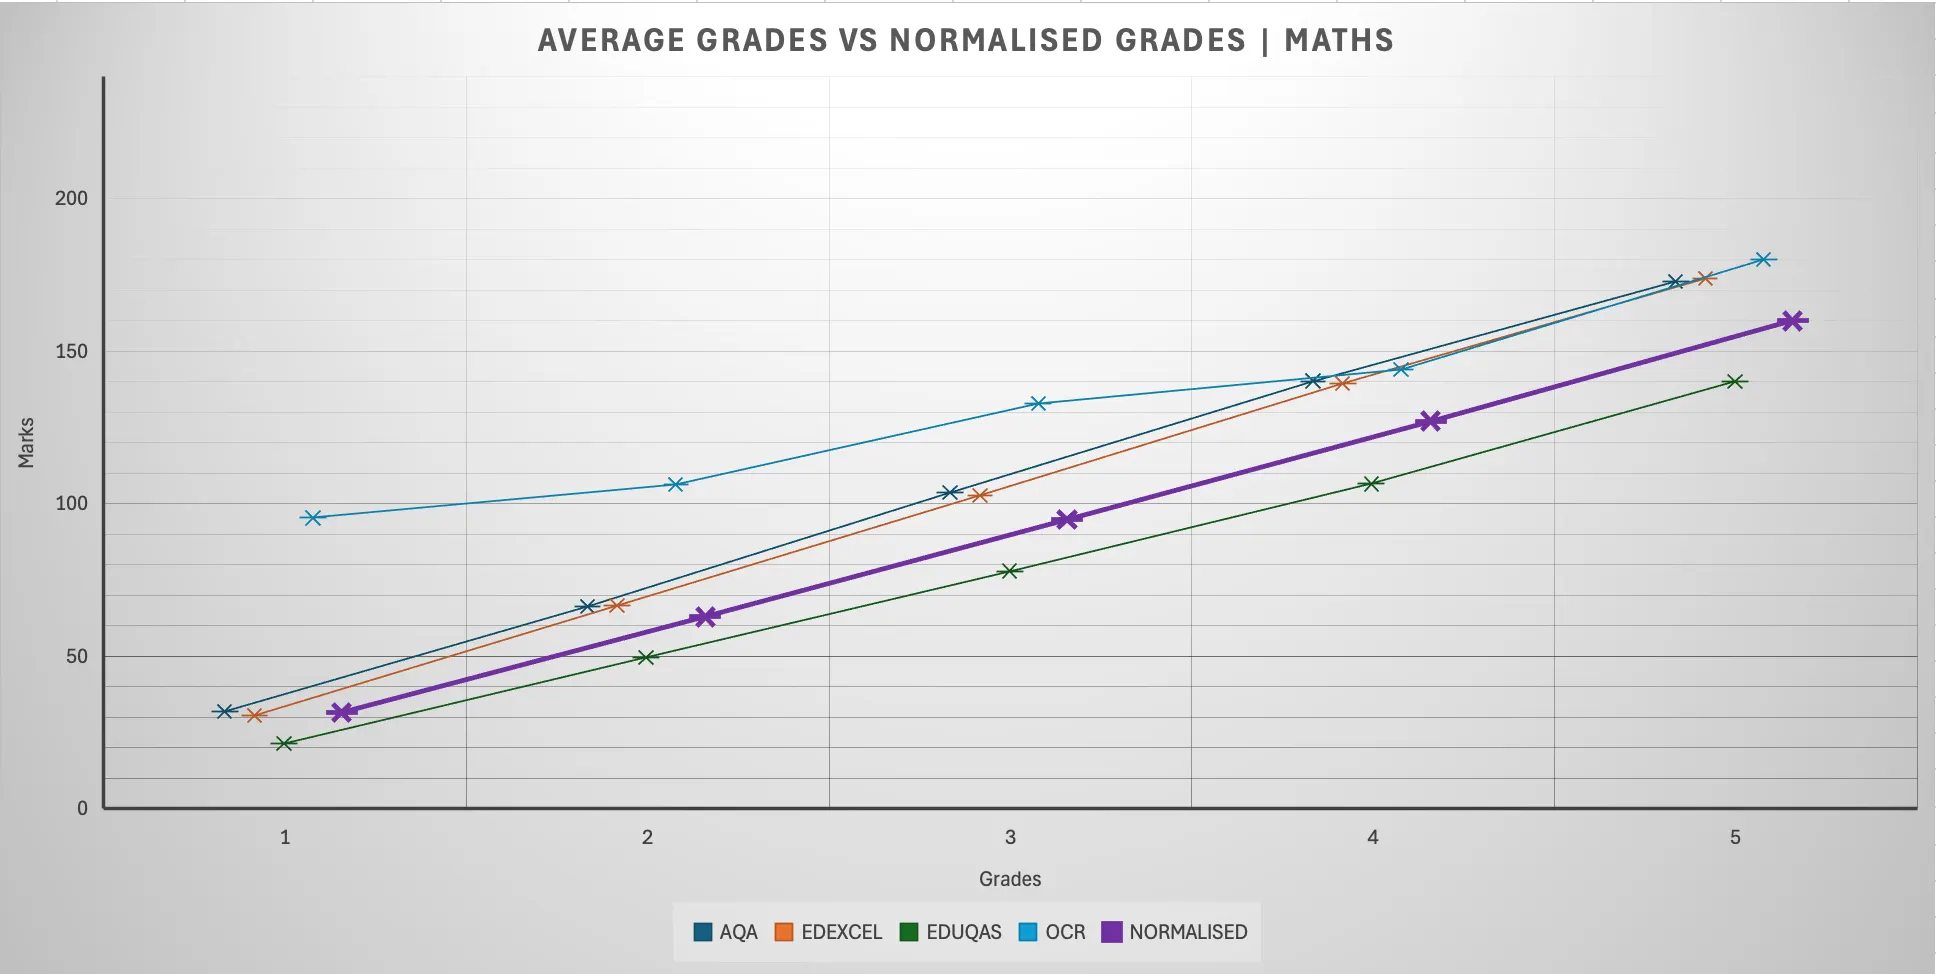
Average Grades Boundaries vs Normalised Grades Boundary | Maths Foundation Tier
This chart plots the average historical grade boundaries for each exam board against the Normalised Grade Boundary across grades 1 to 5 for GCSE Maths (Foundation Tier). It provides a clear visual comparison of how each board's boundaries relate to one another and to the normalised benchmark.
AQA and Edexcel track closely together across all grades, suggesting a broadly consistent approach to boundary setting between the two boards. Eduqas sits consistently lower throughout, indicating that learners need proportionally fewer marks to achieve each grade — a pattern that persists across the full grade range.
OCR, however, stands out as a clear outlier. Its boundaries are markedly higher than all other boards at every grade, and the line shows a notable degree of inconsistency in its trajectory — particularly at the lower grades, where it diverges sharply from the other boards before partially converging at grade 5. This volatility raises questions about the comparability of OCR's grade boundaries year on year, and suggests that a learner's grade outcome on an OCR paper may be more sensitive to the specific demands of a given year's paper than on other boards. This is precisely the kind of inter-board variation that the Normalised Grade Boundary seeks to address, by providing a stable, evidence-based reference point that sits independently of any single board's approach.
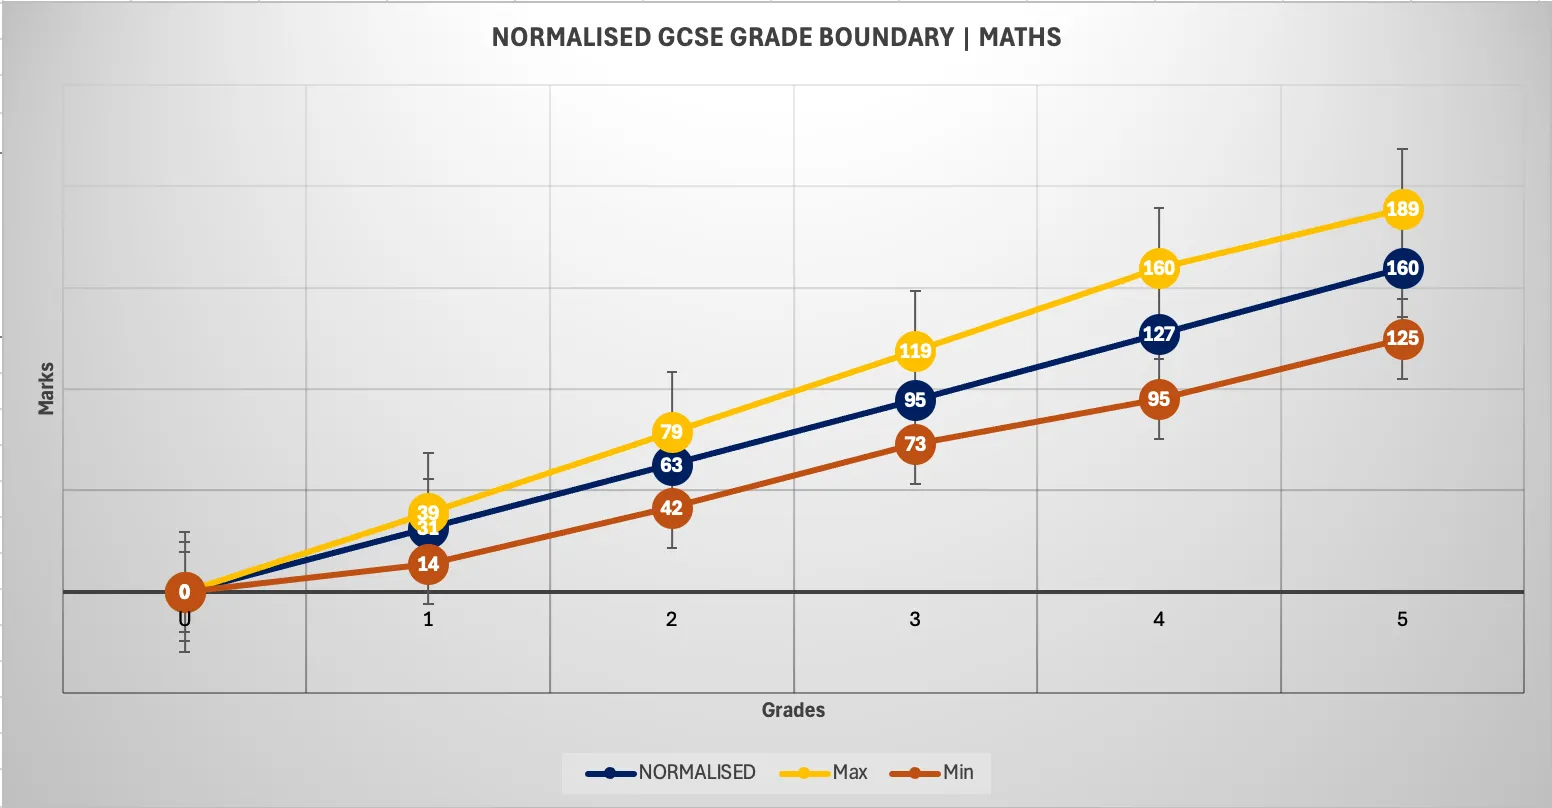
Normalised Grades Boundary vs Historical Upper and Lower Bounds
This chart displays the Normalised Grade Boundary for GCSE Maths (Foundation Tier) across grades 1 to 5, plotted alongside the historical maximum and minimum boundaries recorded across all exam boards and years. The error bars at each grade point further illustrate the range of variation observed in the historical data.
The Normalised boundary sits consistently between the upper and lower bounds, as intended — reflecting its purpose as a balanced, central reference point rather than being skewed towards any particularly generous or demanding year. At grade 1, the boundaries converge closely, with a relatively narrow spread between the maximum of 39 and the minimum of 14, suggesting reasonable consistency at the lower end across boards and years. However, as grades increase, the gap between the maximum and minimum widens considerably. By grade 5, the upper bound reaches 189 marks against a lower bound of just 125 — a spread of 64 marks. This is a striking finding, and highlights just how significantly grade boundaries can diverge at the higher end depending on the exam board and year in question.
This widening spread is a direct consequence of the inter-board variation discussed elsewhere, and serves as a compelling argument for the Normalised boundary's value. A learner sitting a grade 5 paper could face boundary requirements that differ by dozens of marks purely as a result of which board their school uses — a disparity that is difficult to justify on educational grounds. The Normalised boundary, at 160 marks for grade 5, provides a consistent and statistically grounded alternative that accounts for this variation, offering a fairer basis for assessing and comparing learner attainment.
The Results
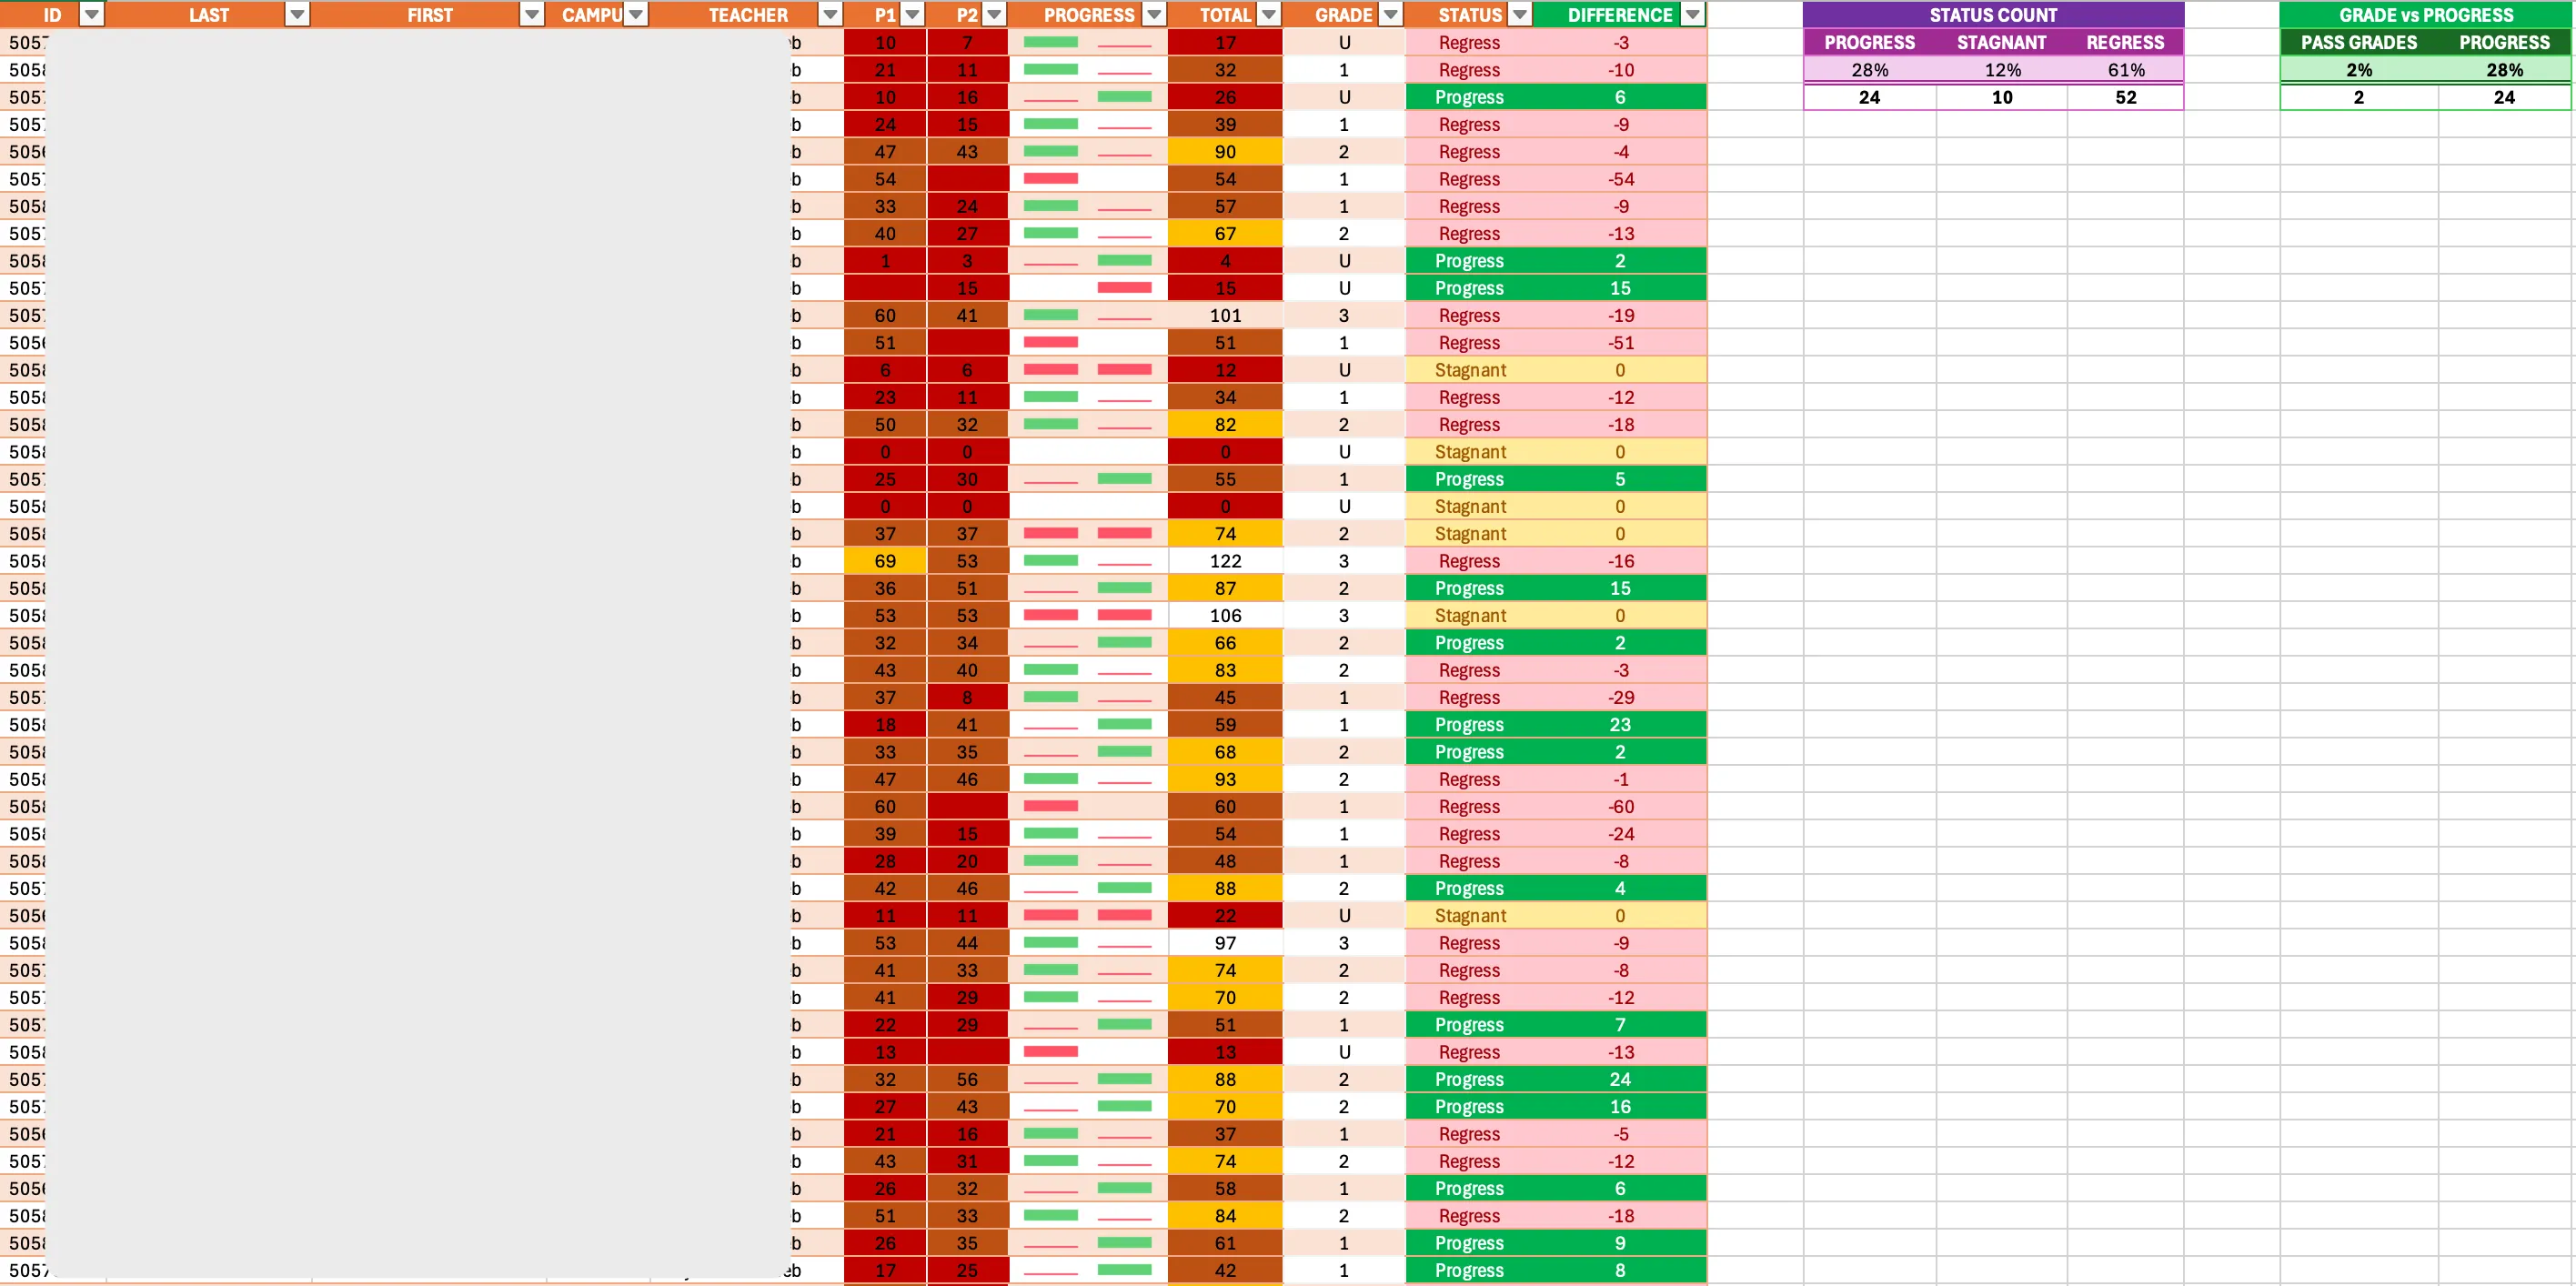
Learners' Results
The Grades Calculator captures each learner's key details — including their Student ID, name, campus, and teacher — and records their mark from two separate exam papers sat from different years. In line with BERA's research ethics guidelines, all personally identifiable information is anonymised before use, ensuring the tool can be used responsibly in a professional or research context.
From the marks entered, the calculator automatically applies the Normalised Grade Boundary to determine the grade attained as a combined mark for both papers. It then compares the two results to identify whether the learner has progressed, regressed, or remained stagnant between the two sittings. Crucially, this comparison operates at two levels: it identifies whether a learner has moved up or down a grade boundary, and also whether they have made meaningful mark gains within their current grade band — even if that movement has not yet translated into a higher grade.
This distinction is particularly significant in the context of Ofsted inspections. Progress is not always reflected in grade outcomes alone, and the calculator makes this visible by evidencing incremental improvement that might otherwise go unrecorded. A learner who has not yet reached their target grade may nonetheless demonstrate clear and measurable progress, and this tool provides the data to support that claim.
Finally, the calculator automatically generates a summary count of all learner outcomes — totalling how many have progressed, regressed, or remained stagnant — giving teachers and leaders an immediate, at-a-glance overview of cohort-level attainment and progress trends.
The Dashboard
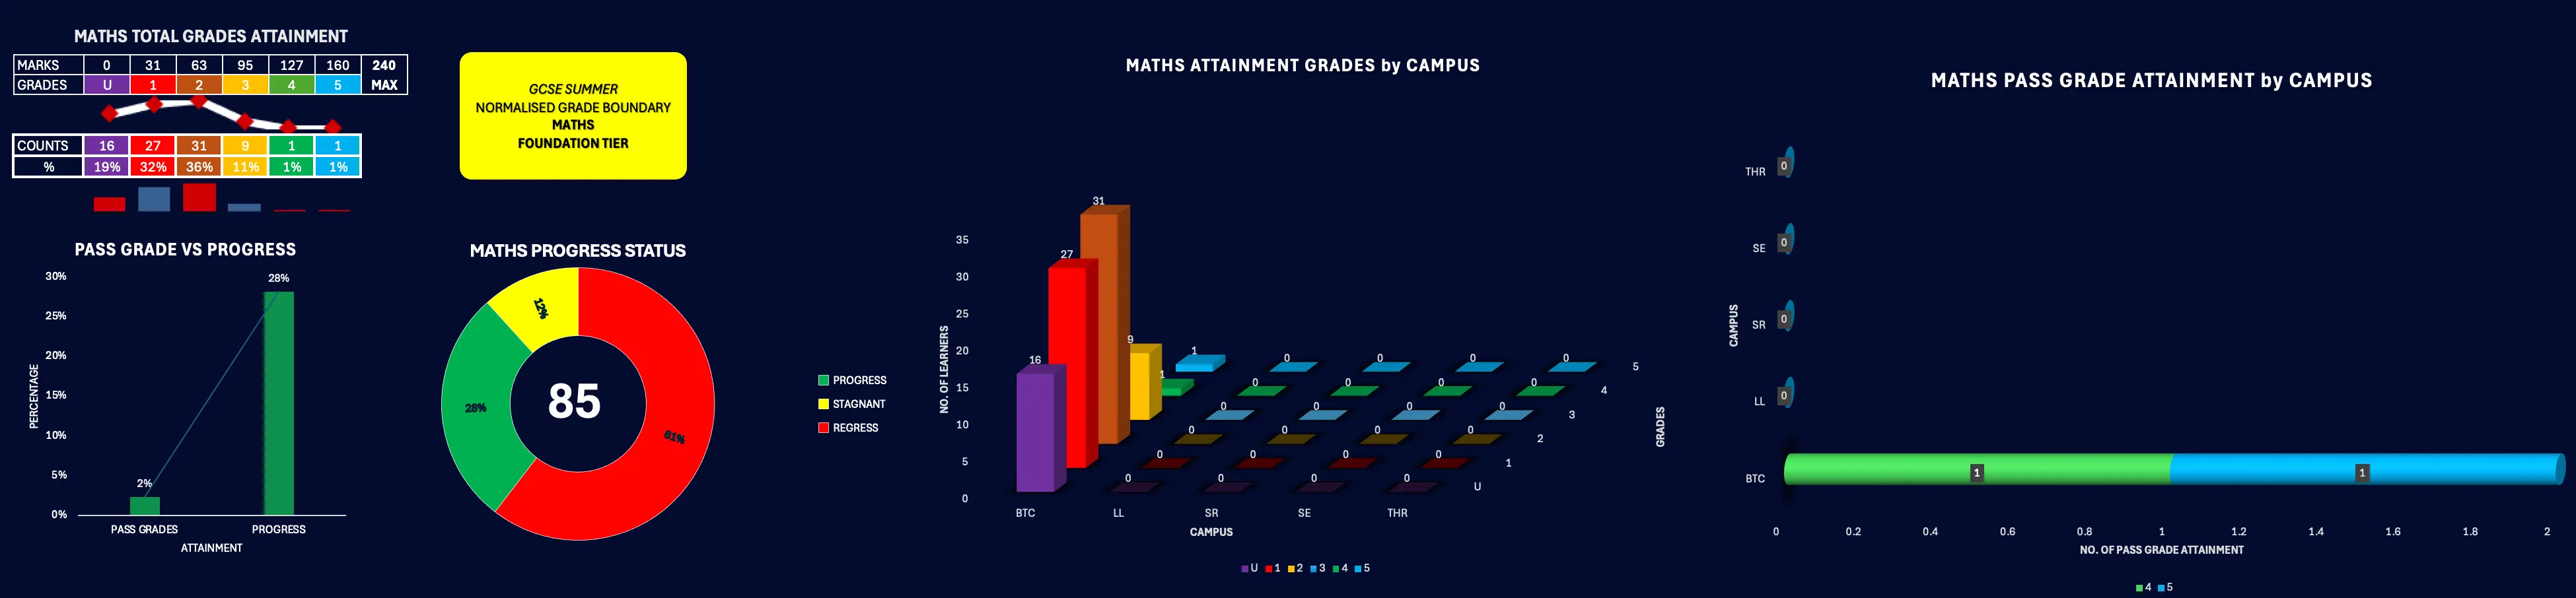
Overview
The Dashboard provides a comprehensive, at-a-glance visual summary of cohort performance, drawing automatically from the data entered in the Grades Calculator.
In the top left, the Normalised Grade Boundary is displayed for reference, accompanied by a count and graphical breakdown of how many learners have attained each grade. To the right of this, a doughnut chart illustrates the proportion of learners who have progressed, regressed, or stagnated, with the total number of learners displayed at the centre of the chart. Adjacent to this, a bar chart compares two key headline figures: the percentage of learners who have attained a pass grade, set against the percentage who have demonstrated measurable progress — reinforcing the point that progress and attainment, while related, are distinct and separately reportable outcomes.
The chart in the centre of the dashboard breaks down grade attainment by campus, allowing direct comparisons to be drawn between sites. Similarly, the bar chart on the far right displays the number of learners achieving a pass grade or above on a per-campus basis, providing leaders with a clear picture of where performance is strongest and where additional support may be needed.
The calculator is designed to require minimal input from the user — only the learners' marks need to be entered, and all calculations, counts, and charts update automatically. When new grade boundaries are added in future years, the entire calculator recalculates without any further manual intervention, keeping the tool current and reducing administrative burden.
An equivalent calculator and dashboard has been produced for GCSE English Language, using the same statistical methodology and layout. Due to space constraints on this page it is not displayed here, but the underlying formulation, structure, and outputs are identical, applied to the English Language grade boundary data respectively.